

ASX Bank Stocks 2027: CBA vs NAB vs Westpac vs ANZ
If you own ASX shares, there's a good chance you own a bank, whether you picked one or not. CBA, NAB, Westpac and ANZ are so large that they sit inside most index funds and super accounts as well. Their latest annual results landed within weeks of each other, and it's rare to see four banks tell such different stories. CBA kept growing. Westpac stood still. NAB's profit fell, mainly because of a one-off accounting change. ANZ's jumped, mostly because last year was weak.
This guide lines the four up side by side, explains what's really driving the numbers, and covers the backdrop that matters most right now: the Reserve Bank has just lifted the cash rate again. It also sets out the questions we'd want answered before forming a view on any of them.
The big four at a glance
| CBA | NAB | Westpac | ANZ | |
|---|---|---|---|---|
| Financial year end | 30 June 2026 | 30 Sept 2026 | 30 Sept 2026 | 30 Sept 2026 |
| Headline profit | $10.98bn cash profit, up 7% | $6.14bn cash earnings, down 13.4% | $6.8bn statutory profit, down 1% | $7.59bn cash profit, up 31% |
| Profit excluding one-offs | n/a | $7.09bn, flat | $6.99bn, up 0.3% | Up 10% (excluding last year's significant items) |
| Full-year dividend per share | $5.05 | $1.70 | $1.54 | $1.66 |
| Final dividend franking | 100% | 100% | 100% | 80% |
| CET1 capital ratio | 12.0% | 11.87% | 12.5% | 11.99% |
| Net interest margin | 2.05% | 1.80% | 1.86% (second half) | 2.30% excluding Markets (second half) |
A few cautions before you read across that table. The banks don't report the same way: CBA's year ended in June while the other three finished in September, and each leans on a different profit measure. ANZ's margin figure excludes its markets business, so it isn't directly comparable with the others. And we've left share prices out on purpose, because they move every day. Check a live price and yield before comparing anything.
Three things stood out when we lined the results up:
- Headline profit misled in both directions. NAB looked worse than it was, and ANZ looked better.
- Bad debt charges rose at most of the banks even as profits held up. That suggests lenders are being more careful about the year ahead.
- Profit growth leaned more on cost control than on lending. Loans grew only around 5% at NAB and Westpac, and 6% at ANZ.
The backdrop: the RBA has lifted rates again
Bank results don't happen in a vacuum, and the economy has shifted under these four. In early November the Reserve Bank lifted the cash rate by 25 basis points to 4.85%. It was the fifth rise this year and the second in a row, and the board was split, with six votes for and three against. The RBA's own forecasts have inflation staying above 3% until the end of 2027, with growth below trend and unemployment drifting up from 4.7% at the end of this year to a bit over 5% by the end of 2028.
The housing market is already feeling it. The RBA says home prices in September were almost 5% below their March peak, and new housing lending has fallen sharply. Business credit, by contrast, is still growing strongly. CommBank's own economists expect the RBA to pause in December, though they say February is still a live meeting and that the risks lean towards higher rates.
For banks, higher rates cut both ways. They can widen the margin a bank earns, but they also put pressure on borrowers, and a slowing housing market means slower mortgage growth. Keep that tension in mind as you read the individual results.
What actually moves a bank's profit
Most of the gap between these four comes down to four things.
Net interest margin. Think of it as the spread: what a bank earns on its loans minus what it pays to fund them. When you're lending hundreds of billions of dollars, a few basis points is a lot of money. CBA's 2.05% sits well above NAB's 1.80% and Westpac's 1.86%, which is a big part of why CBA earns more on every dollar it lends. When banks fight over mortgage customers, or depositors move cash into higher-paying accounts, that spread gets squeezed.
Bad debts. Banks set money aside for loans that might go wrong, and this year most of them set more aside. NAB's charge jumped 85.7% to $1.55bn, mostly on business lending, and Westpac's more than doubled to $864m. CBA's rose 9% to $788m, though its loan loss rate is still a thin 8 basis points. ANZ's total loss rate was just 4 basis points against a long-run average of 11, but its collective provisions still climbed by $108m. On these numbers it isn't a red flag yet, but it's the line we'd watch most closely if unemployment starts to rise.
Costs. This is where the year was won or lost. Westpac cut expenses by 1%, ANZ's cost-to-income ratio improved by 416 basis points to 49.26%, and NAB's everyday costs grew 4.5% to $10.3bn. With loan growth at around 5%, who controls costs matters a lot.
Capital and dividends. The CET1 ratio is a bank's safety cushion, measured against minimums set by APRA. A bigger cushion gives a bank more room to pay dividends and repurchase shares. All four sit between roughly 11.9% and 12.5%, so none is short of capital, but the differences affect how much flexibility each has.
How each bank did
Commonwealth Bank (ASX: CBA)
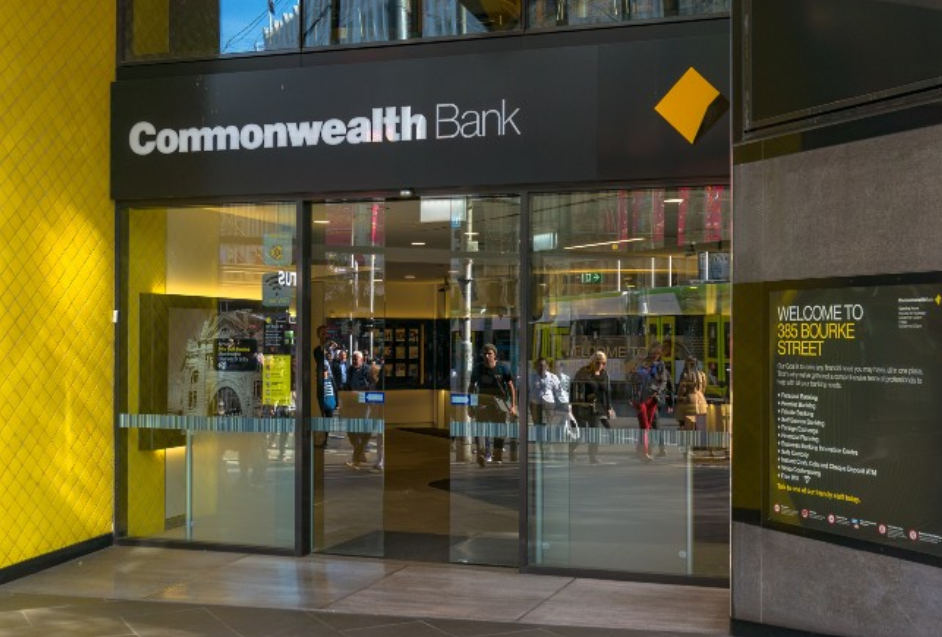
CBA is the giant of the group, and the numbers show it. Cash profit rose 7% to $10.98bn, the margin ticked up 3 basis points to 2.05%, and the full-year dividend rose 4% to $5.05, fully franked. That's a payout of 77% of profit, inside its 70 to 80% target. Its CET1 ratio of 12.0% is comfortably above APRA's 10.25% minimum. A $1bn share repurchase programme was only partly used, with $300m completed, and it won't be extended.
Management calls the economy resilient but slowing, and says housing activity has cooled from its peak, with loan applications stabilising in recent weeks. The question to research is how much of CBA's strength is already in the share price, because it has long traded at a premium to the other three. A live price and valuation check will tell you more than last year's result can.
NAB (ASX: NAB)

NAB's headline looks rough, but it pays to read past it. Cash earnings fell 13.4% to $6.14bn, mainly because of one-off charges ($1.35bn before tax, $949m after) after it changed how it accounts for software. Strip those out and earnings were $7.09bn, flat on last year, and NAB says underlying profit rose 6.9%. The margin improved 6 basis points to 1.80%, the full-year dividend held at $1.70 with the final payment fully franked, and CET1 rose 17 basis points to 11.87%.
What deserves a closer look is the $1.55bn bad debt charge, up from $833m. Most of it, $1.08bn, was individually assessed charges, mainly on business lending, a part of the book that grew a strong 9.8% this year. NAB is also cutting up to 2,500 roles and expects underlying cost growth below 3% next year, excluding restructuring. Its own economists forecast GDP growth of 1.4% this year and 1.0% in 2027.
Westpac (ASX: WBC)

Westpac had a steady, slightly unglamorous year. Statutory profit slipped 1% to $6.8bn, while profit before one-offs edged up 0.3% to $6.99bn. Costs fell 1%, pre-provision profit rose 4%, deposits grew 6% to $766.2bn and loans grew 5% to $901.3bn. The full-year dividend rose to 154 cents, and its CET1 ratio of 12.5% is the highest of the four.
Against that, its margin has drifted down from 1.95% in the second half of last year to 1.89% in the first half and 1.86% in the second half of this year. Bad debt charges more than doubled to $864m, which Westpac put down to a revised economic outlook, lending growth and extra overlays. CEO Anthony Miller says customers are coping unevenly and expects interest rates to stay elevated into 2027.
ANZ Group Holdings Ltd (ASX: ANZ)

ANZ's 31% jump in cash profit to $7.59bn needs some context. Last year included big one-off items, so the cleaner comparison is a 10% rise. The real story is cost control: the cost-to-income ratio fell to 49.26% in the first year of the ANZ 2030 strategy, and management expects costs to stay flat on a pro forma base of $11.26bn next year. Loans grew 6%, with institutional lending up 12%.
The full-year dividend was 166 cents, with the final payment 80% franked, up from 75% at the interim, and a 66% payout that is above its own 60 to 65% target range. CET1 came in at 11.99%, down 4 basis points on a year ago, partly because of its Worldline Australia acquisition. Bad debts remain low at a 4 basis point loss rate. Management says the margin should be broadly stable in the first half of next year, and the CEO calls 2027 pivotal, so how the strategy delivers is the thing to track.
Key risks for ASX bank stocks
- Bad debts climbing. Charges are already up at CBA, NAB and Westpac, and the RBA expects unemployment to keep rising.
- A cooling housing market. Mortgages are the heart of all four businesses, so slower lending or falling prices hit everyone.
- Margin squeeze. Competition for home loans and deposits can eat into margins even while rates stay high, as Westpac's slipping margin shows.
- Rates cut both ways. Higher rates can fatten margins, but they also strain borrowers, and the RBA says inflation may stay above 3% until late 2027.
- They move together. Owning two or three of the big four isn't the same as being diversified.
- One-offs and rules. Capital requirements, remediation costs, restructuring and accounting changes (like NAB's this year) can swing reported profit.
How to research ASX bank shares
- Start with the latest results announcement, and note the year end, because the banks report on different dates.
- Look at profit before one-offs, not only the headline number.
- Check the margin and the bad debt charge, not just profit growth.
- Compare CET1 and payout ratios to see how well covered the dividend looks.
- Get a live share price, dividend yield and franking level. These change every day.
- Ask how much of your portfolio already leans on banks and housing, including through index funds and super.
Our guide to Australian shares that pay high dividends and our interest rate impact analysis cover related ground, and our ASX stocks to watch overview sets banks alongside seven other sectors. You can also browse every ASX bank company page.
General advice warning: This article is general information only and is not personal financial advice. It does not take into account your objectives, financial situation or needs. Consider whether it is appropriate for you and read the Financial Services Guide before acting. Stockbinge Pty Ltd is a Corporate Authorised Representative of Titan Securities Pty Ltd (AFSL 307040). Past performance is not a reliable indicator of future performance.
FAQ
What are the big four ASX banks? Commonwealth Bank (CBA), National Australia Bank (NAB), Westpac (WBC) and ANZ Group (ANZ).
What did the RBA do to interest rates? In early November 2026 it raised the cash rate by 25 basis points to 4.85%, the fifth increase this year, on a split 6 to 3 vote.
Which big bank pays the highest dividend? In dollars, CBA, at $5.05 per share for FY26. But that figure doesn't tell you much on its own, because the share prices are so different. Yield and franking make a fairer comparison, and both depend on the current price.
Are ASX bank dividends franked? The final dividends from CBA, NAB and Westpac were fully franked, and ANZ's was 80% franked. What franking is worth to you depends on your own tax situation.
How do interest rates affect bank shares? Higher rates can widen the margin a bank earns, but they also make it harder for borrowers to keep up repayments. The overall effect differs between banks and changes with the economy.
Are ASX bank shares risky? Every share carries risk, including the risk of losing money. Banks are tied to the housing market, bad debts and regulation, and the big four tend to rise and fall together.
Want to see how we research ASX companies? Browse our free reports.
Sources: CBA 2026 full year results, NAB 2026 full year results, Rask Media on NAB, StockwireX on NAB, Westpac FY26 release, Rask Media on Westpac, ANZ FY26 release, ANZ CFO investor briefing, RBA Statement on Monetary Policy