 info@stockbinge.com.au
 03 8609 4895

Report
- DXN Ltd ASX-DXN


DXN Ltd ASX-DXN
| DXN Ltd | Team StockBinge | 29-Apr-2026 | ASX:DXN |
Recommendation: Buy | Sector: Technology
DXN Limited engages in the design, manufacture, ownership, and operation of data centers and related infrastructure in Australia. It operates through two segments: Data Centre Manufacturing and Data Centre Operations. The Data Centre Manufacturing segment engineers, constructs, and commissions modular data centre solutions for mining, gas and energy, subsea, and defense industries, as well as telecommunication applications, such as satellite, radio centers, and cable landing stations. The Data Centre Operations segment operates data centres that provides space, power, cooling, and physical security for clients to house their computer servers and related storage and networking equipment, as well as offers cloud and co-location hosting services. In addition, the company is involved in the provision of connectivity solutions comprising cloud interconnection, fiber cross-connects, internet, and cloud span services; and engineering as a service, project management, data center management, and maintenance and engineering services. DXN Limited was incorporated in 2017 and is based in Sydney, Australia.
| Risk | Low to Medium |
| Market Cap ($) | 6.60m |
| Shares Outstanding | 314.20m |
| Beta | 1.1239 |
| EPS (TTM) | -0.0145 |
| PE (TTM) | - |
| Dividend Yield (%) | - |
| 52 Week Range ($) | 0.016 - 0.08 |
| Target Price ($) | 0.045 |
| Stop Loss ($) | 0.013 |
Stock Performance Profile:
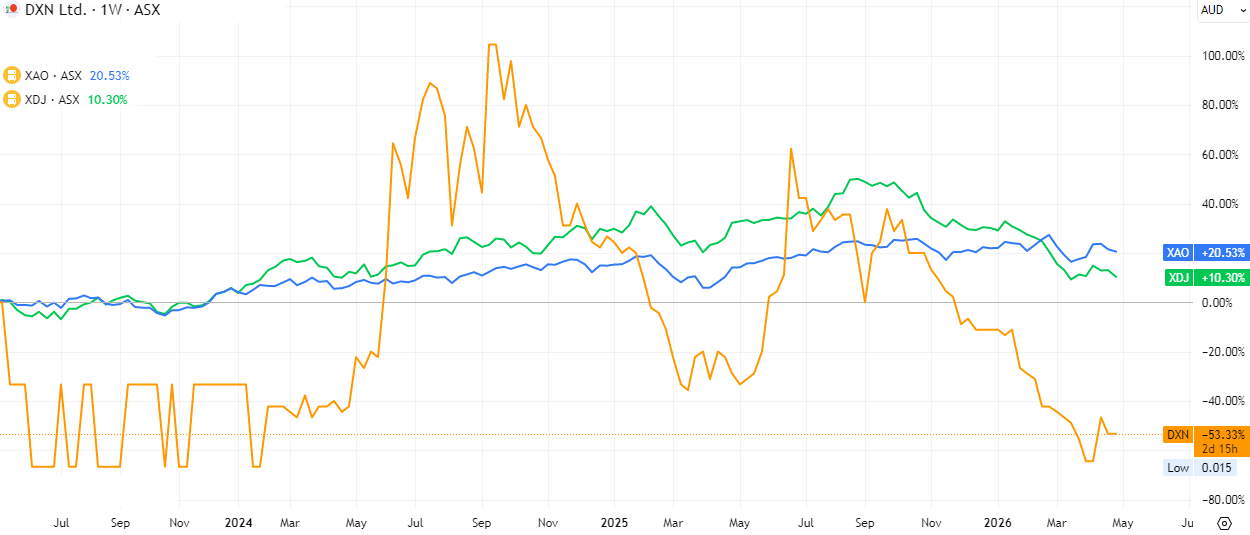
Source: Trading View
| Financial Summary | ||||
| Key Items | FY22 | FY23 | FY24 | FY25 |
| Revenue ($m) | 14.263 | 6.576 | 10.755 | 16.028 |
| EBITDA ($m) | (2.438) | (2.035) | 0.262 | (0.128) |
| Net Income ($m) | (6.902) | (9.613) | (2.303) | (2.314) |
| Financial Strength | ||||
| Current Ratio | 1.4x | 0.8x | 1.6x | 0.4x |
| Debt/Equity | NM | NM | 131.1% | 310.3% |
| EBITDA / Interest | NM | 0.8x | 0.2x | NM |
Source: Company filings, StockBinge’s analysis
The company’s revenue performance has been highly volatile but shows an improving long-term trajectory. Revenue declined sharply from $14.3m in FY22 to $6.6m in FY23, indicating either weaker demand, project delays, or a one-off normalization after a stronger prior year. However, the business recovered well in FY24 to $10.8m, followed by a strong rise to $16.0m in FY25, which is the highest level in the four-year period. This suggests that the company has been able to rebuild its sales pipeline, improve market traction, or benefit from improved execution. The FY25 growth momentum is particularly encouraging, as it not only reverses earlier weakness but also surpasses FY22 revenue, indicating expanding scale.
On the operating profitability side, EBITDA remains weak despite revenue growth, reflecting cost pressures and limited operating leverage. EBITDA losses improved from -$2.4m in FY22 to -$2.0m in FY23, and the company briefly turned EBITDA positive at $0.3m in FY24, showing signs that the business model could potentially scale profitably. However, the return to a slight EBITDA loss of -$0.1m in FY25, despite record revenue, suggests that costs increased alongside growth, possibly due to expansion spending, inflationary pressures, or rising fixed overheads. While the EBITDA loss is marginal compared with earlier years, the inability to sustain positive operating earnings remains a concern.
The net income trend shows consistent bottom-line losses, although the magnitude has improved significantly since FY23. Losses widened from -$6.9m in FY22 to -$9.6m in FY23, marking the weakest year in the period. This was followed by a sharp improvement to -$2.3m in FY24, which was largely maintained in FY25 at -$2.3m. The stabilization of net losses over the last two years indicates better cost control and possibly fewer exceptional charges. However, the persistence of losses despite revenue expansion suggests the company still faces challenges around depreciation, finance costs, or non-operating expenses that are preventing full earnings recovery.
From a financial strength perspective, liquidity has deteriorated materially by FY25, which is a key risk. The current ratio moved from 1.4x in FY22 to 0.8x in FY23, recovered strongly to 1.6x in FY24, but then dropped sharply to 0.4x in FY25. A ratio below 1.0x signals that short-term liabilities materially exceed short-term assets, raising concerns around working capital management and near-term cash obligations. The FY25 decline is particularly worrying because it comes in a year of strong revenue growth, implying that sales expansion may be consuming cash rather than generating it.
The capital structure has become increasingly leveraged, adding further balance-sheet stress. Debt-to-equity was not meaningful in FY22–FY23, but rose sharply to 131.1% in FY24 and further to 310.3% in FY25. This steep rise indicates aggressive reliance on debt funding, likely to support operations, expansion, or cover ongoing losses. Such a highly leveraged position significantly increases refinancing risk and limits financial flexibility. Additionally, EBITDA-to-interest coverage remained very weak, at 0.8x in FY23 and only 0.2x in FY24, before becoming non-meaningful in FY25 due to negative EBITDA. This suggests the company’s operating earnings are insufficient to comfortably service interest costs, which is a major solvency concern.
Overall, the company is showing strong top-line momentum and improving loss containment, but the balance sheet has weakened substantially, with deteriorating liquidity, rising leverage, and poor interest coverage. The key positive is that revenue has reached a new peak in FY25, indicating commercial traction. However, unless management can convert this growth into sustained positive EBITDA and stronger cash generation, the rising debt burden and weak short-term liquidity may outweigh the benefits of sales growth. The near-term outlook therefore depends heavily on the company’s ability to improve margins, preserve working capital, and reduce dependence on external financing.
Industry Overview
The Real Estate Services industry’s performance has fluctuated in recent years, influenced by rising house prices, climbing interest rates and volatility dwelling transfer numbers. Interest rate increases after the pandemic significantly dampened the number of dwelling transfers, reducing demand for real estate services. However, the industry has since rebounded from the 2023 low. Slowly easing interest rates and renewed buyer confidence have driven a surge in residential property transactions and elevated agency revenues, despite persistent high borrowing costs and constrained housing supply. Robust housing prices, government incentives and strong migration have fuelled residential demand. Commercial sector growth is concentrated in premium CBD assets amid weak secondary office markets. Profit margins expanded after the pandemic because of increased housing prices before tightening in 2022-23 following interest rate hikes. Sticky interest rates have kept margins from expanding in recent years. Industrywide revenue is anticipated to have fallen at an annualised 1.0% over the past five years and is expected to total $30.9 billion in 2024-25, when revenue will increase by an estimated 2.3%.The Real Estate Services Industry exhibits low market share concentration, comprising many small, independent operators. The largest provider is Ray White, which operates under a franchise model with over 700 locations. Geographically, the industry is concentrated in the populous eastern states of New South Wales, Queensland and Victoria. Areas like the Northern Territory and Tasmania have fewer agencies because of their lower house prices and populations.Looking ahead, strong migration-driven population growth will reinforce demand pressures on Australia’s real estate market, with ongoing housing shortages amplifying competition for both owner-occupied and rental properties. Agencies positioned to capitalise on expanding rental demand, sustainable building initiatives, and growth in regional hubs and build-to-rent (BTR) assets are set to outperform. This comes as rising prices and flexible work fuel a shift away from traditional homeownership and office space. The industry’s profit and growth outlook increasingly hinges on adapting digital services, managing evolving tenant needs and aligning with climate regulation and eco-friendly property trends. Industry revenue is projected to rise at an annualised 1.3% through 2029-30 to total $33.0 billion.
Source: IBIS World
Risk Analysis
DXN Ltd faces execution and financial-position risks as a micro-cap modular data centre company operating in a project-driven market. The biggest near-term risk is timing delays in converting its backlog into revenue, as management itself noted softness in 1H FY26 due to slower project progression. A large share of earnings depends on successful delivery of a relatively small number of contracts, so any customer deferrals, cost overruns, or supply-chain disruptions can materially affect margins and cash flow. In addition, DXN remains exposed to working-capital pressure, debt servicing, and potential shareholder dilution if growth investments or project delays require further capital raising. Competitive pressure from larger data-centre infrastructure players and rapid technological shifts in AI and edge computing infrastructure also add strategic risk.
Outlook
The outlook for DXN Ltd remains cautiously positive but execution-dependent. The company entered FY26 with a healthy backlog of around A$14.5 million, a growing Asia-Pacific expansion strategy, and new momentum in its Data Centre as a Service (DCaaS) model, which could improve recurring and capital-light revenue streams. Management expects roughly 65% of backlog conversion over the next two quarters, with revenue weighted toward 2H FY26, suggesting a stronger second half if project milestones are met. Longer term, demand from AI infrastructure, edge computing, logistics, mining, and Southeast Asian digital markets gives DXN a credible growth runway, though sustained profitability will depend on scaling revenue faster than fixed costs and preserving balance-sheet strength.
StockBinge’s Forecast
For FY26, DXN Ltd is likely to deliver a strong step-up in revenue to around A$20–22 million, driven by conversion of its A$14.5 million backlog, an expanded 80-project identified pipeline, and increasing traction in higher-margin DCaaS, hyperscale, satellite gateway, and Southeast Asian modular deployments, with management already indicating growth will be weighted toward 2H FY26. After reporting FY25 revenue of A$16.0 million with its first positive EBITDA result, FY26 EBITDA could reasonably improve into the A$1.8–2.5 million range, supported by better factory utilisation, export-led scale benefits, and recurring service income from its Darwin and Hobart data centre assets. While financing costs may still keep statutory NPAT near breakeven or a small loss, the company’s operational momentum suggests material cash-flow improvement and a clear pathway to sustained profitability by FY27, especially if large APAC DCaaS contracts and Indonesia manufacturing opportunities ramp as expected.
Technical Analysis
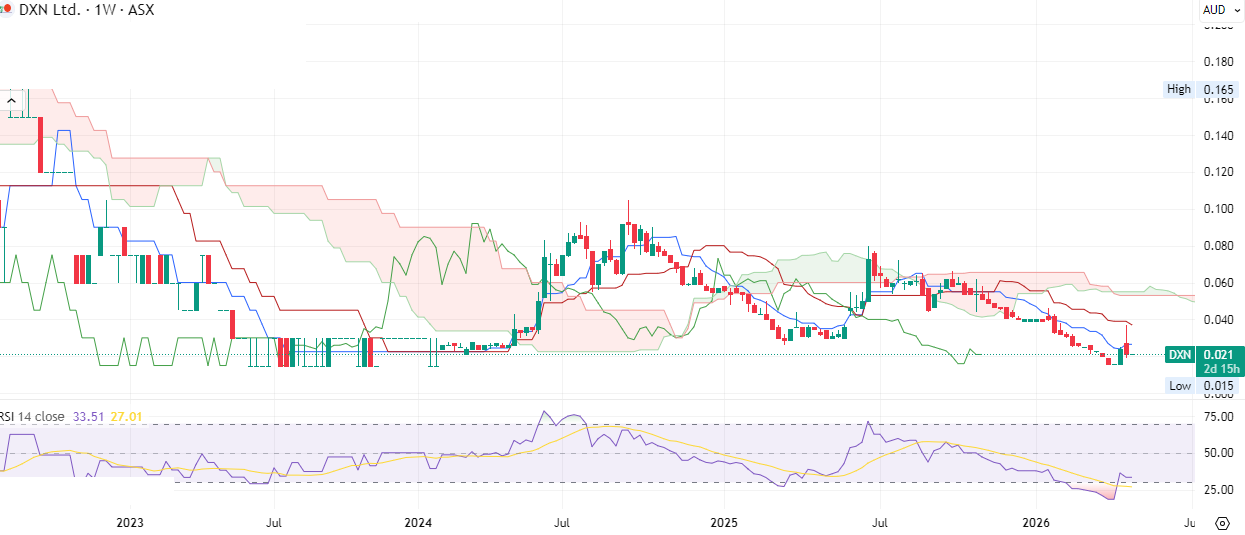
Source: Trading View
StockBinge’s View:
DXN Limited holds a cautiously positive outlook, supported by a solid backlog, expanding APAC presence, and growing traction in its DCaaS model. FY26 is expected to deliver meaningful revenue and EBITDA improvement, driven by project execution, higher factory utilisation, and increasing recurring income. However, performance remains execution-dependent, with profitability hinging on timely backlog conversion and cost discipline. While near-term NPAT may remain subdued, improving cash flows and strong demand from AI, edge computing, and Southeast Asia position the company on a credible path toward sustainable profitability by FY27. Technically, despite trading near all-time lows, the stock appears to be forming a base, suggesting potential stabilisation at current levels. Moving averages are gradually aligning constructively, supporting a positive bias in the short to medium term. Volume trends indicate accumulation, with stronger participation on up-moves and relatively lower activity during declines. Momentum indicators also remain in positive territory without showing overbought conditions, indicating scope for a gradual recovery. StockBinge recommends a “Buy” at the closing price of $0.021 (as of 28th April 2026) with stop loss of $0.013 and Target will be $0.045 for coming few months.
Disclaimer:Stockbinge Pty Ltd (ACN: 672 177 347) is a Corporate Authorised Representative (CAR No 001309039 of Titan Securities Pty Ltd (AFSL no 307040). Under these authorisations, Stockbinge is authorised to provide general financial product advice to retail clients in respect of certain classes of financial products, which include securities, government bonds, and debentures. Any financial product advice provided is general advice only and does not take into account your personal objectives, financial situation, or needs. Stockbinge provides stock research reports, which may include factual information and general financial product advice about securities and debentures. Securities trading involves a high level of risk and may not be suitable for all investors. You should obtain personal financial advice from a licensed financial adviser before making any investment decisions. Past performance is not indicative of future results. For further details, please refer to our Financial Services Guide (FSG) available on our website.
- Download Report:
- Download
ABN 54 672 177 347 | ACN 672 177 347
Copyright © 2026 StockBinge. All Right Reserved. Design by StockBinge.